

Your AI’s Confidence Is Writing Checks Its Data Can’t Cash (Part 1/3): The AI Data Layer Problem
AI Lessons Learned


Introduction: The Reliability Gap
Many organizations are already using AI outputs as inputs to real decisions. That is where the problem begins. You cannot trust AI-generated analytics unless they are grounded in a real data layer. That is my opinion, but one based on applied testing across real use cases. When large language models generate numbers instead of retrieving them from verifiable datasets, the outputs may appear reliable, but they rest on unstable foundations.
Across a series of experiments, a consistent reliability gap emerged. The failures that will be discussed fall into three categories: 1/ directional inaccuracy, 2/ bias sensitivity, and 3/ repeatability and consistency failure. Each of these weaknesses becomes more concerning as organizations increasingly use generative AI for workforce intelligence, benchmarking, prioritization, and automated decision support. This first article focuses on the data layer problem and the consequences of directional inaccuracy, illustrated through a talent pipeline study using validated labor market data.
The Illusion of Knowledge
Large language models are increasingly producing outputs that look reliable and accurate, and many people are beginning to treat those outputs as though they are grounded in real data. They generate ranked lists, scoring models, talent benchmarks, and similarity analyses that appear structured, legitimate, and ready for usage in decisions. The presentation creates an illusion of credibility, and it is easy to mistake that polish for reliability.
Three separate analyses were conducted which highlight this pattern of failures:
In a workforce sourcing test, the model generated a credible-looking ranking of companies that produce top Data Science talent, but when compared to validated labor market data, the ordering was directionally incorrect.
In an NBA GOAT scoring experiment, small changes in prompt wording produced statistically significant anchoring bias even when the structured task and dataset remained identical.
In a multi-model consistency benchmark, repeating the same structured request across multiple runs and multiple LLMs produced different answers, demonstrating a lack of repeatability.
LLMs are impressive tools for accelerating thinking, structuring analytical frameworks, and reducing time between question and approach. But without grounding in real, verifiable datasets, they do not yet operate as trustworthy quantitative engines.
This article focuses on the first failure mode: directional inaccuracy driven by the absence of a reliable data layer.
What a Data Layer Means in an LLM Context
When I refer to a “data layer” in the context of large language models, I am not talking about the model’s training data or its general knowledge. I am referring to a live, explicit, and verifiable source of truth that the model retrieves from at the moment it generates an answer. A proper data layer consists of structured datasets, maintained by a trusted system of record, that the model is forced to reference rather than invent. This can include labor market databases, financial systems, operational metrics, transactional records, or any domain-specific repository that provides authoritative values for the task at hand. Without such a layer, the model is not querying facts. It is estimating them.
This distinction matters because large language models are fundamentally probabilistic reasoning systems. When asked for numbers, rankings, or distributions without access to a real data layer, the model will either produce a null response or it generates values that are statistically plausible within the structure of the content from which it was trained. The output may appear accurate, but it is not grounded in reality unless an external data source is injected into the reasoning process. Without a data layer, even well-formatted quantitative outputs are potentially structured hallucinations.
Use Case: The Talent Pipeline Study
The first experiment explored whether a large language model could identify which companies would be the strongest sources of Data Scientist talent for a major tech employer. This type of question is becoming increasingly relevant as organizations explore whether generative AI may assist with workforce planning, talent intelligence, and sourcing strategy. If these systems are ever trusted to inform decisions, their accuracy matters.
To assess reliability, the same request was evaluated using two different inputs:
One relied on a verified labor market dataset from Lightcast containing real skill distributions.
The second depended on an LLM-generated version of those skill distributions, created when the model was prompted to describe the expected skill composition for each company.
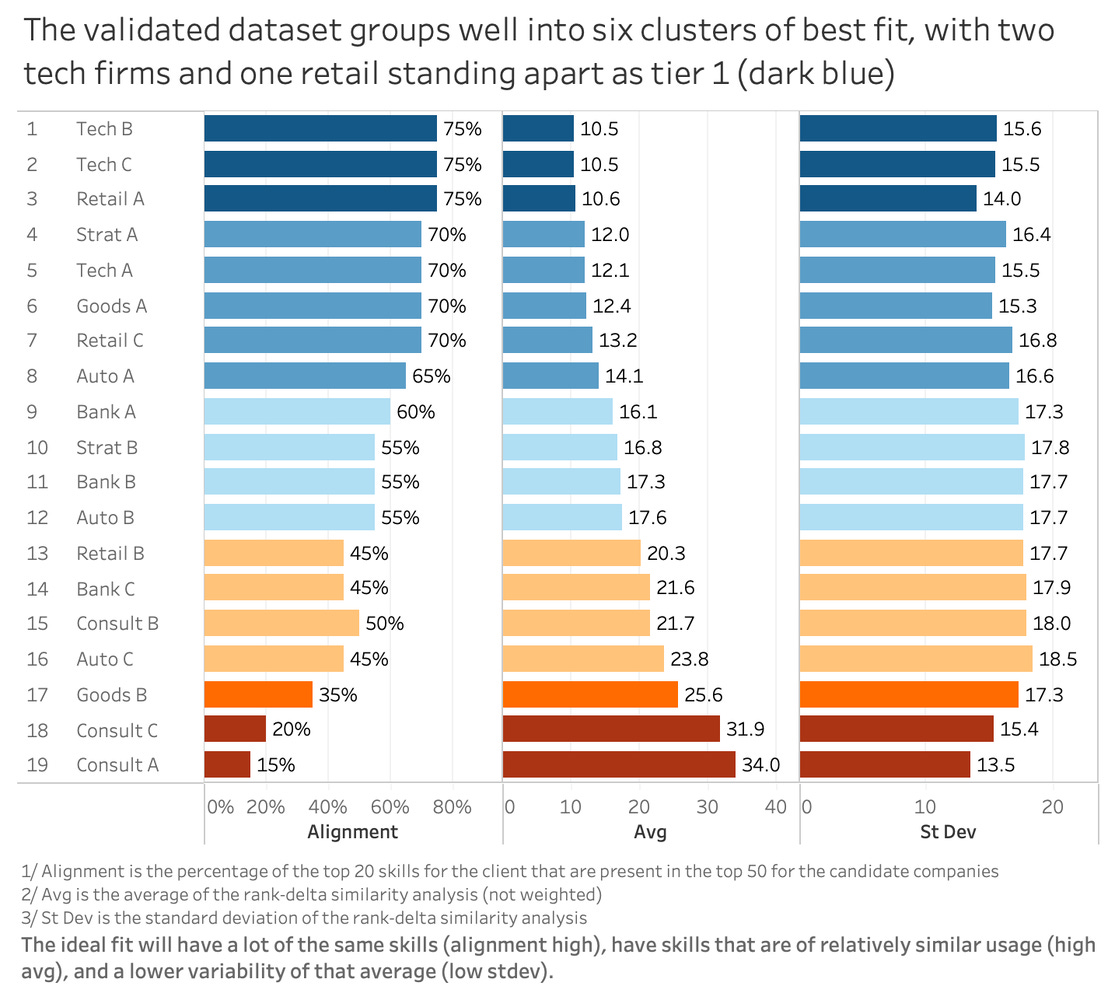
Both datasets were then analyzed using the Rank Delta Similarity Analysis method described in the appendix. This method evaluates how similarly companies prioritize skills rather than simply whether they share them, making it well suited for identifying meaningful alignment. Visualizations to represent alignment of the potential source companies with the baseline tech company are shown below.
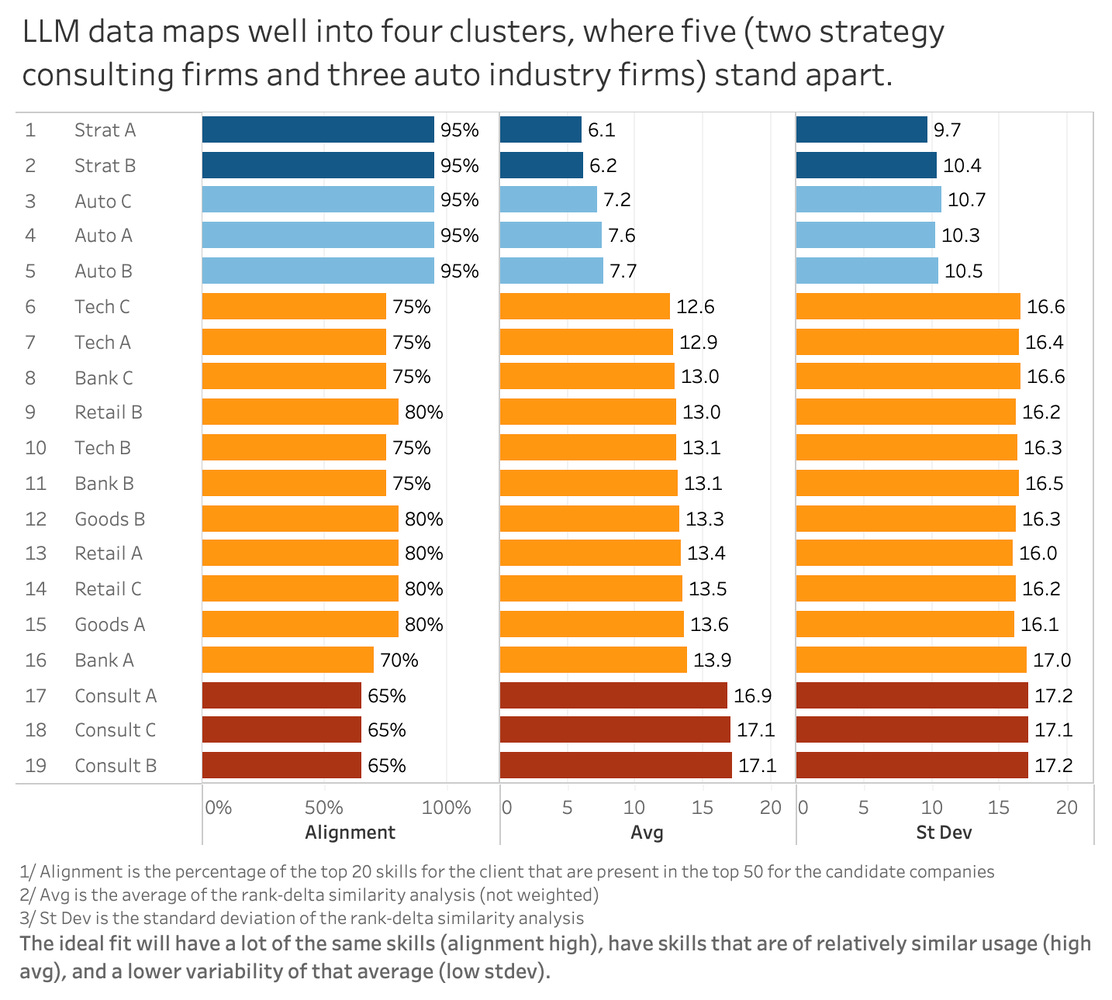
The primary ask when looking at these first two figures is to get a feeling for what the results look like. There are additional notes in the appendix and the notes below each figure. That said, two takeaways should be that for in Figure 1, you will see that there are two peer tech companies at the top, with the third not far down at #5, as having the most alignment with the baseline tech company conducting the search. As should be expected, the rank-delta between the skills for these companies is also in the low double-digits. This makes logical sense that tech companies would be relatively similar to our baseline tech company. We see a shift in Figure 2, as these companies are replaced at the top by strategy consulting firms and auto manufacturers.
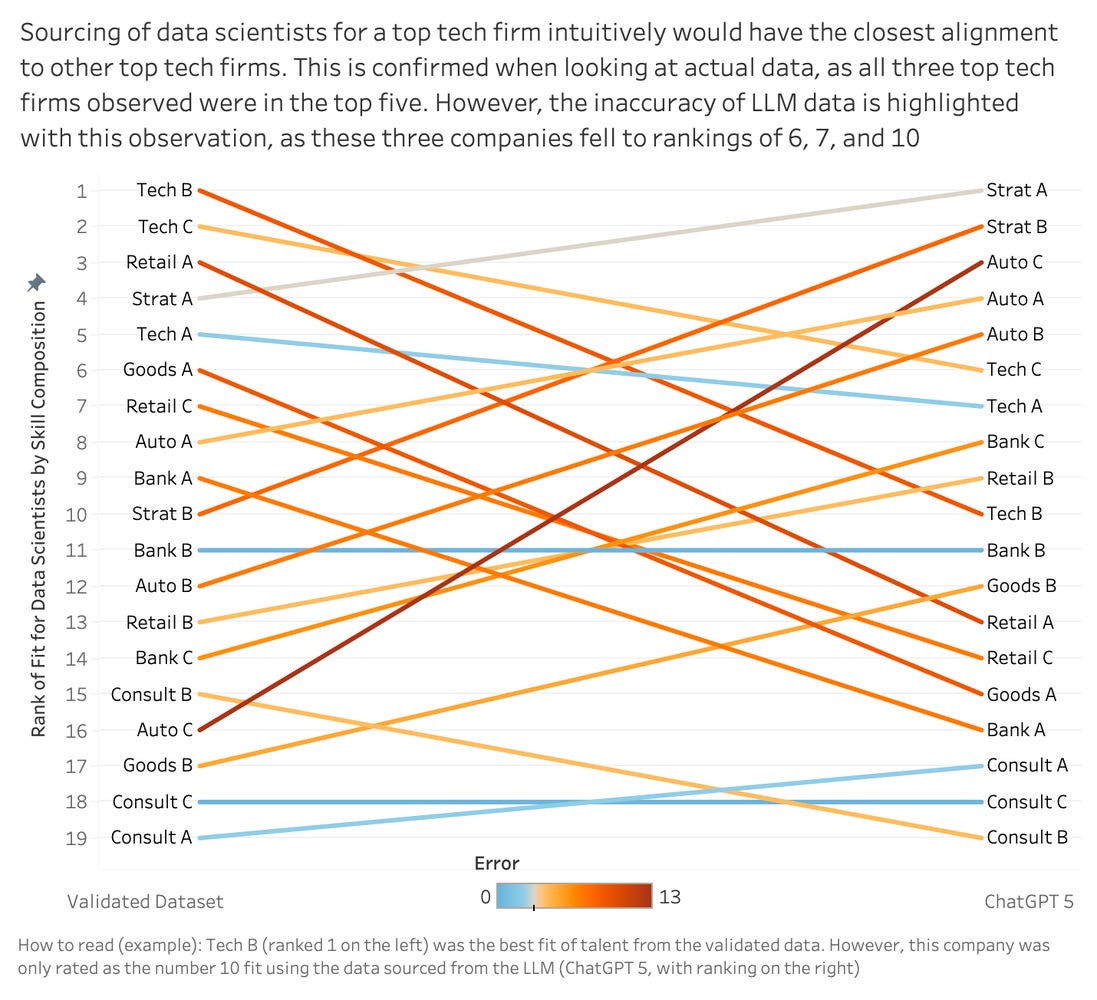
Once visualized side by side, the difference between the two datasets became difficult to ignore. Companies that ranked near the top in the verified dataset were misplaced significantly in the LLM output. The strongest match dropped to tenth in the model-generated version, while several low-alignment companies moved into top positions. On paper, the LLM output appeared structured and logical, yet the underlying rankings told a very different story.
This experiment surfaced a critical reliability gap. When a model lacks access to real underlying data, it does not leave blanks. It generates synthetic values that appear reasonable but do not reflect reality. The output is fundamentally misaligned with the truth it is attempting to represent. Once the underlying data is incorrect, every conclusion downstream built on it inherits that error.
In practical terms, this means that two organizations asking the same sourcing question, using the same model, can walk away with materially different and equally confident answers, where only the one based on the data layer with the vendor data is accurate.
Why This Matters for Workforce Strategy
Directional error is more dangerous than missing information. When data is missing, leaders know they do not know. When data is synthetically generated and looks plausible, leaders believe they know, and the organization acts on it. That is how small analytical errors compound into structural workforce misalignment.
The danger is not that LLMs are wrong. Every analytical system is wrong sometimes. The danger is that they are wrong while appearing precise. The formatting, the structure, the confidence of the output encourages trust over skepticism.
This is the first pillar of the reliability gap. Without a verifiable data layer, AI-generated data are approximations branded as evidence. Without a real data layer, AI generates hallucinations, while giving off the illusion of knowledge.
The next article in this series examines the second pillar: bias sensitivity. Even when models are given the same dataset, their quantitative reasoning shifts based on subtle changes in wording, tone, and implied intent. The NBA GOAT experiment exposes how that bias operates in practice.
Appendix: Rank Delta Similarity Analysis
The Rank Delta Similarity Analysis process follows these steps. First, each company’s skills are ranked by the percentage of employees who demonstrate each skill, where one represents the most common skill. Skills with zero percent representation are removed and missing skills are assigned a default rank of fifty for consistency. The delta between ranks is calculated for each skill, then the absolute value of each delta is taken to remove directional bias. The analysis focuses on the baseline company’s top twenty skills, those defining its talent profile. The deltas for those skills are averaged to produce a single alignment score per company. Companies are then ranked from lowest to highest average delta, where smaller scores indicate stronger alignment. Finally, the method checks how many of the baseline company’s top twenty skills appear among the top fifty skills of each candidate company.
Disclaimer: The views and opinions expressed in this article are solely those of the author and do not reflect the official policy or position of any current or former employer. Any content provided in this article is for informational purposes only, was not obtained through a current or former employer, and should not be taken as professional advice.